2 January 2012
10:40 IST
Mining · West Africa
Africa’s Mali produces 43.5 tons of gold in 2011
Mali closed 2011 as the region’s third-largest producer, with output split between a few industrial mines and an unmeasured artisanal sector.

The mining file is where the archive is furthest from the trading screen: annual output by country, grades and shafts, artisanal production nobody could measure, and governments reconsidering the terms on which foreign companies dig.
1 restored dispatch 2011–2016 covered
The gold mining file is largely a record of annual production figures, and it is most useful read as a set rather than one story at a time. Over the period, China consolidated its position as the largest producer while consuming far more than it mined; Australia, Russia and the United States held broadly steady; several West African countries grew; and South Africa continued the long decline that took it from dominating world output to a mid-table position. None of that is surprising now. What the archive adds is the contemporaneous framing: how each figure was reported at the time, and what the reporting expected next.
The African stories are the most substantial part of the gold mining news kept here. Mali, Ghana, Burkina Faso and Tanzania all appear with output figures and project news, and in each case the total is an industrial number plus an artisanal estimate. That estimate is not a rounding error: in some of these countries informal production is a double-digit percentage of the total, and it responds to the gold price faster than any industrial operation can.
Artisanal and small-scale gold mining recurs throughout the section, usually with two figures attached: how much gold it produces and how much mercury it releases. Peru is the case the archive covers most closely, with illegal production estimated at around eighteen tonnes a year and documented pollution in the Madre de Dios region. This is the only part of the file that reads as environmental reporting rather than as market reporting, and it is one of the reasons the section is worth preserving intact.
This page is current writing, so its mechanisms can be checked against the bodies that publish them. Figures inside the restored dispatches stay as filed.
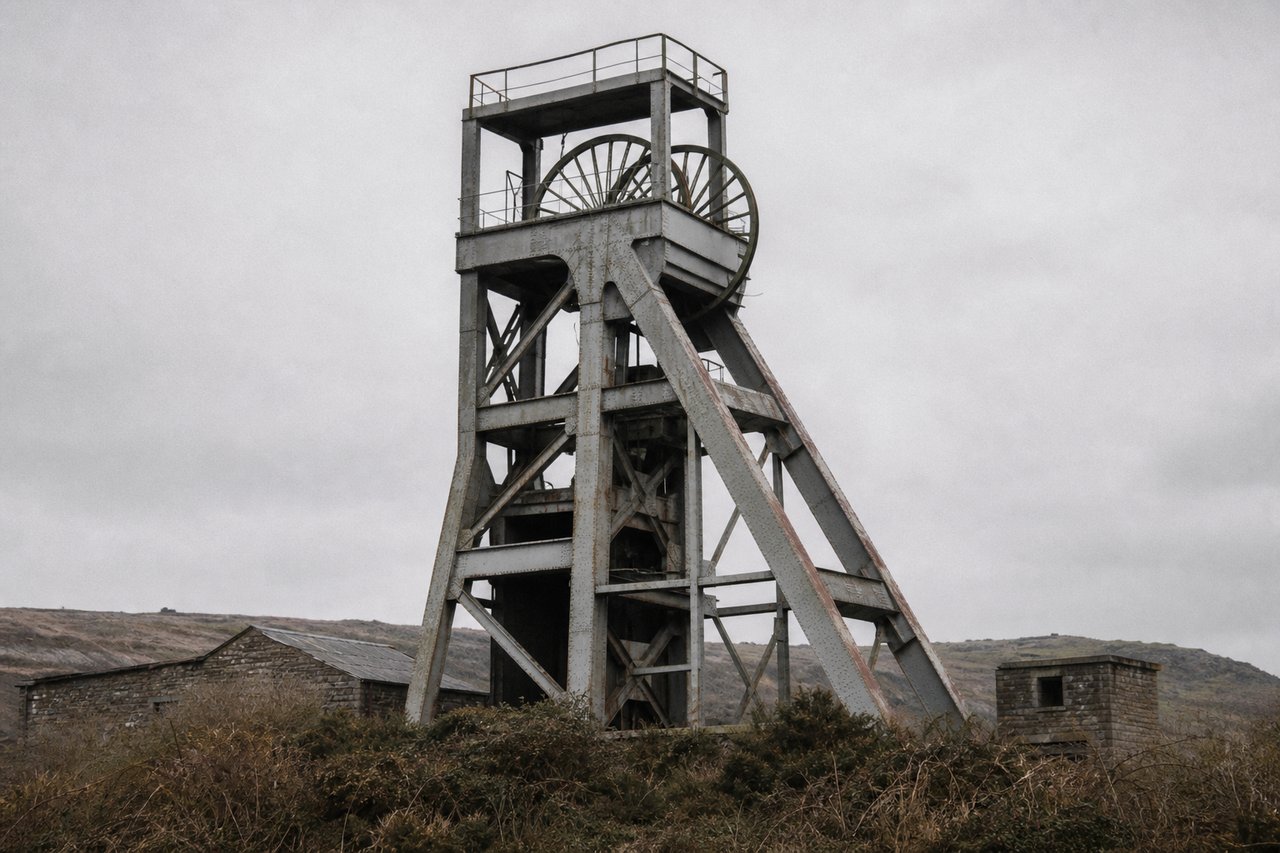
Project news follows the price with a lag of roughly a year. The 2011 and 2012 dispatches are full of expansions, feasibility studies and new shafts; from mid-2013 the same companies appear announcing deferrals, and from 2014 the vocabulary is cost curves, all-in sustaining cost, and care-and-maintenance. Reading the gold mining news chronologically is the clearest illustration in the whole archive of how a metal price transmits into physical activity: slowly, and mostly through capital decisions rather than through output.
The original site carried three templated directories, one for mining companies, one for individual mines and one for jewellery retailers, totalling 2,462 URLs. They were near-empty database entries, a name and an address with little else attached, and rebuilding them would have produced hundreds of thin pages for no measurable benefit. They are not restored. The companies among them that the desk actually reported on are covered in this hub and in company news, whichever matches their subject.
2 January 2012
10:40 IST
Mali closed 2011 as the region’s third-largest producer, with output split between a few industrial mines and an unmeasured artisanal sector.
What the mining file holds from 2011 to 2016: country output figures, project and production updates, the illegal-mining estimates, and the nationalisation disputes that ran through the period.
Industrial production is reasonably reliable because it is refined, weighed and taxed. Artisanal and small-scale production is not: it is by definition informal, and in several of the countries in this section it is a substantial share of the total. So a national figure is usually an industrial number plus an estimate, and the honest ones say so. Mali's 2011 total is a good example: the restored dispatch keeps the estimate visible instead of presenting the total as measured.
A resource is metal that geologists are confident is there. A reserve is the part of it that can be extracted profitably under current conditions, which means a reserve shrinks when the price falls even though the rock has not changed. This is why announcements of enormous resources should not be read as future supply, and why the same deposit can be reported as vast in one year and uneconomic in the next.
Because prices had tripled over the preceding decade and the contracts governing extraction had generally been signed before that. When the value of what leaves the ground rises far faster than the state's share of it, the terms get revisited: sometimes as a tax change, sometimes as an export levy, occasionally as an outright ownership dispute. The archive records several of these, and the pattern is closely tied to the gold price rather than to any change in the mines themselves.
It is an attempt to state what an ounce costs to produce and to keep producing: mine-site cash costs plus the sustaining capital, royalties and corporate overhead that a cash-cost figure leaves out. It became the standard number once the price fell, because a cash cost says nothing about whether an operation survives, while an all-in figure can be read straight against the price. The same companies announcing expansions in 2012 were publishing cost curves by 2014 and putting shafts on care and maintenance, which means idling an operation while keeping it dewatered and licensed rather than closing it. For the permanent version of that decision, see the platinum section.